PlacesProvince
Khyber Pakhtunkhwa
Khyber Pakhtunkhwa has 40,856,097 people and covers 101,741 sq km.
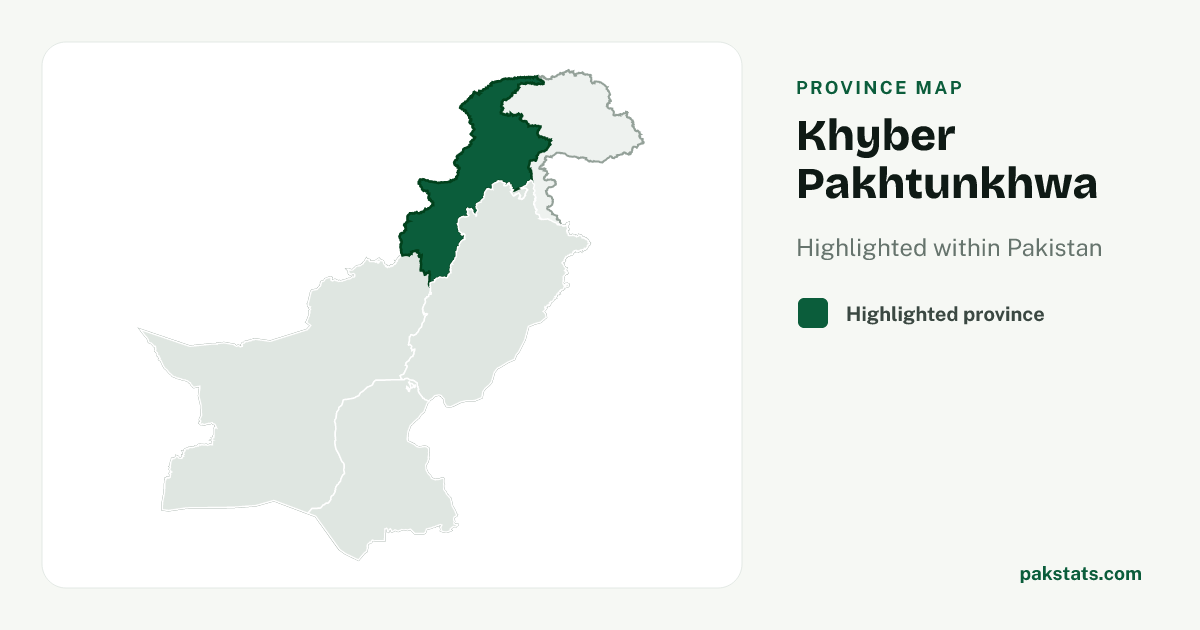
Province map
Map of Khyber Pakhtunkhwa
40,856,097
People counted in the 2023 census
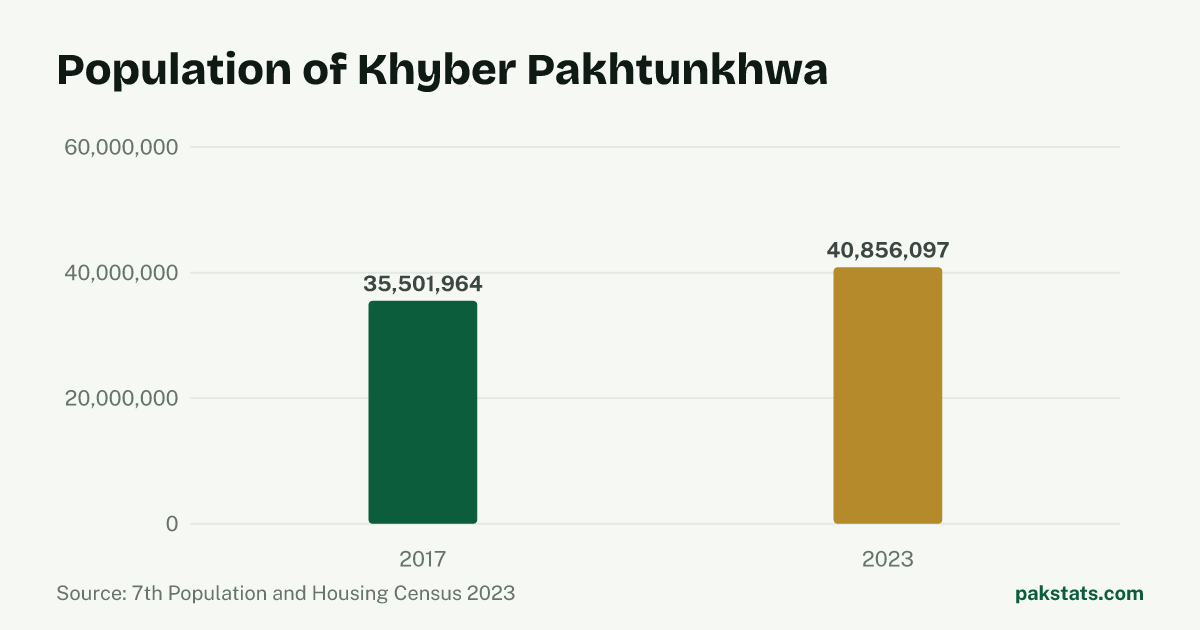
Change since 2017
| Census | People |
|---|---|
| 2023 | 40,856,097 |
| 2017 | 35,501,964 |
Key numbers
- 101,741 sq kmArea
- 401.6People per sq km
- 15.0%Share living in towns and cities
- 6.9People per household
- 104.18Men per 100 women
- 2.38%Population growth a year
Who lives here
| Group | People | Share |
|---|---|---|
| Men | 20,845,747 | 51.0% |
| Women | 20,009,233 | 49.0% |
| Transgender people | 1,117 | 0.0% |
| People in villages | 34,724,801 | 85.0% |
| People in towns and cities | 6,131,296 | 15.0% |
Literacy and school attendance
PBS defines this literacy rate for people aged 10 and older. Rural and urban values are shown only where the census reports them.
| Group | Literacy rate |
|---|---|
| Overall | 51.1% |
| Men | 64.6% |
| Women | 37.1% |
| Rural | 48.4% |
| Urban | 65.6% |
4,924,152 children aged 5–16 were recorded as out of school.
Inside Khyber Pakhtunkhwa
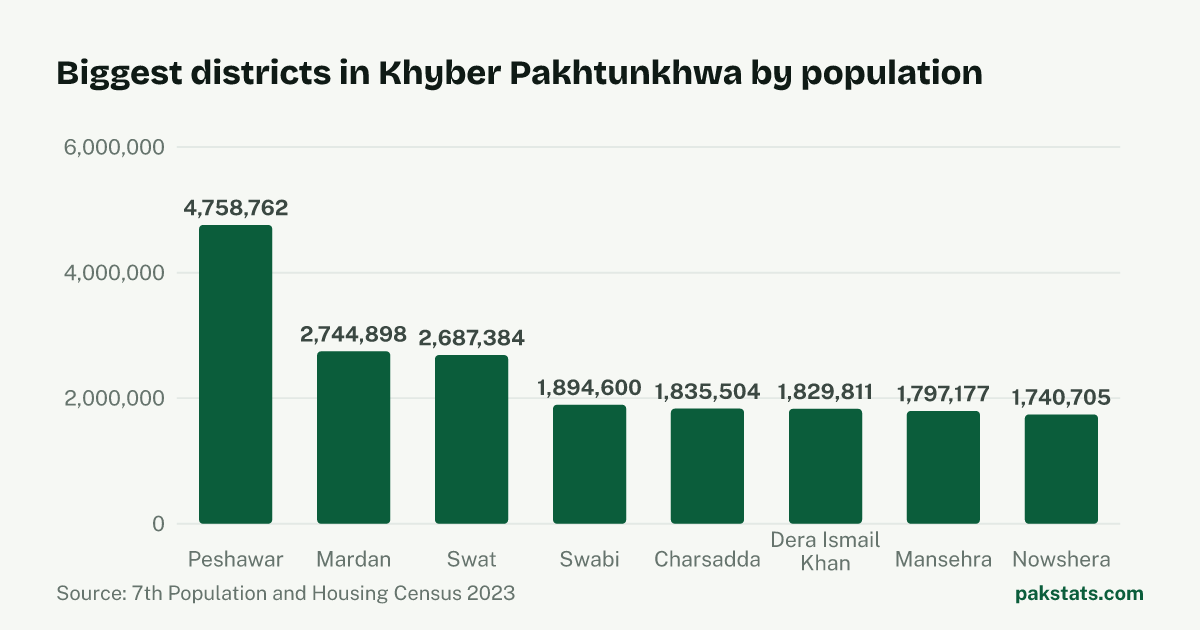
| District | People | Area (sq km) | Share |
|---|---|---|---|
| Peshawar | 4,758,762 | 1,518 sq km | 11.6% |
| Mardan | 2,744,898 | 1,632 sq km | 6.7% |
| Swat | 2,687,384 | 5,337 sq km | 6.6% |
| Swabi | 1,894,600 | 1,543 sq km | 4.6% |
| Charsadda | 1,835,504 | 996 sq km | 4.5% |
| Dera Ismail Khan | 1,829,811 | 9,334 sq km | 4.5% |
| Mansehra | 1,797,177 | 4,125 sq km | 4.4% |
| Nowshera | 1,740,705 | 1,748 sq km | 4.3% |
| Lower Dir | 1,650,183 | 1,583 sq km | 4.0% |
| Abbottabad | 1,419,072 | 1,967 sq km | 3.5% |
| Bannu | 1,357,890 | 1,972 sq km | 3.3% |
| Bajaur | 1,287,960 | 1,290 sq km | 3.2% |
| Kohat | 1,234,661 | 2,991 sq km | 3.0% |
| Haripur | 1,174,783 | 1,725 sq km | 2.9% |
| Khyber | 1,146,267 | 2,576 sq km | 2.8% |
| Upper Dir | 1,083,566 | 3,699 sq km | 2.7% |
| Lakki Marwat | 1,040,856 | 3,296 sq km | 2.5% |
| Buner | 1,016,869 | 1,865 sq km | 2.5% |
| Shangla | 891,252 | 1,586 sq km | 2.2% |
| South Waziristan | 888,675 | 6,620 sq km | 2.2% |
| Malakand | 826,250 | 952 sq km | 2.0% |
| Karak | 815,878 | 3,371 sq km | 2.0% |
| Kurram | 785,434 | 3,380 sq km | 1.9% |
| North Waziristan | 693,332 | 4,707 sq km | 1.7% |
| Batagram | 554,133 | 1,301 sq km | 1.4% |
| Mohmand | 553,933 | 2,296 sq km | 1.4% |
| Hangu | 528,902 | 1,097 sq km | 1.3% |
| Tank | 470,293 | 2,900 sq km | 1.2% |
| Upper Kohistan | 422,947 | 5,440 sq km | 1.0% |
| Orakzai | 387,561 | 1,538 sq km | 0.9% |
| Lower Kohistan | 340,017 | 642 sq km | 0.8% |
| Lower Chitral | 320,407 | 6,458 sq km | 0.8% |
| Kolai Palas Kohistan | 280,162 | 1,410 sq km | 0.7% |
| Torghar | 200,445 | 454 sq km | 0.5% |
| Upper Chitral | 195,528 | 8,392 sq km | 0.5% |
Common questions about Khyber Pakhtunkhwa
- What is the population of Khyber Pakhtunkhwa?
- Khyber Pakhtunkhwa had 40,856,097 people in the 2023 census. The 2017 census counted 35,501,964, so there are 5,354,133 more people now.
- How fast is Khyber Pakhtunkhwa growing?
- The population of Khyber Pakhtunkhwa grew 2.38% a year between the 2017 and 2023 censuses. That is slower than Pakistan as a whole, which grew 2.55% a year.
- How big is Khyber Pakhtunkhwa?
- Khyber Pakhtunkhwa covers 101,741 square kilometres. That works out at 401.6 people per square kilometre. A household here holds 6.9 people on average.
- How many people in Khyber Pakhtunkhwa live in towns and cities?
- 6,131,296 people in Khyber Pakhtunkhwa live in towns and cities and 34,724,801 live in villages. That makes it 15.0% urban.
- How many men and women live in Khyber Pakhtunkhwa?
- The census counted 20,845,747 men and 20,009,233 women in Khyber Pakhtunkhwa. It also counted 1,117 transgender people. That is 104.18 men for every 100 women.
- What is the literacy rate in Khyber Pakhtunkhwa?
- The 2023 census literacy rate for people aged 10 and older in Khyber Pakhtunkhwa was 51.1%. It was 64.6% for men and 37.1% for women, a gap of 27.4 percentage points.